IMAGE@IEA
Carbon dioxide (CO2)
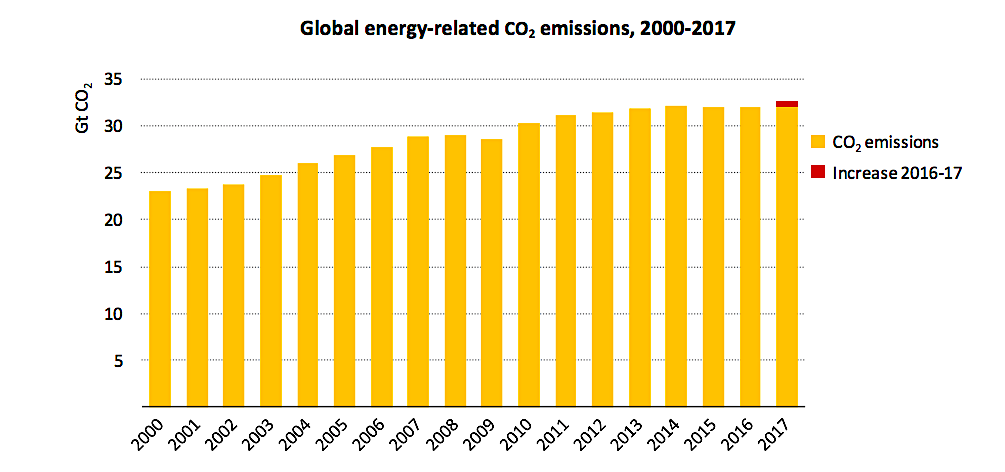
Global energy-related CO2 emissions grew by 1.4% in 2017, reaching a historic high of 32.5 gigatonnes (Gt), a resumption of growth after three years of global emissions remaining flat. The increase in CO2 emissions, however, was not universal. While most major economies saw a rise, some others experienced declines, including the United States, United Kingdom, Mexico and Japan. The biggest decline drop came from the United States, mainly because of higher deployment of renewables.
Latest trends in renewables
Renewables saw the highest growth rate of any energy source in 2017, meeting a quarter of global energy demand growth last year. China and the United States led this unprecedented growth, contributing around 50% of the increase in renewables-based electricity generation, followed by the European Union, India and Japan. Wind power accounted for 36% of the growth in renewables-based power output.
Renewables saw the highest rate of growth of any energy source in 2017 and met around a quarter of global energy demand growth last year. The power sector played the most important role in the growth of low-carbon energy, with renewables-based electricity generation increasing by 6.3% (380 TWh) in 2017. Renewables now account for 25% of global electricity generation.
China and the United States together accounted for half of the increase in renewables-based electricity generation, followed by the European Union (8%), Japan and India (with 6% of growth each). The growth of wind power and solar PV in 2017 was unprecedented; wind power accounted for the largest share of overall renewables growth, at 36%, followed by solar PV (27%), hydropower (22%) and bioenergy (12%).
China accounted for 40% of the combined growth in wind and solar PV, with new record capacity additions and a reduction in the rate of curtailment. Nearly 40% of the increase in hydropower was in the United States, while the European Union reduced hydro output by nearly one-tenth. The European Union, China and Japan accounted for 82% of global bioenergy growth in power.
China overtook the United States to become the world leader for non-hydro renewables-based electricity generation. Global solar PV capacity approached 400 GW by the end of 2017. It was an extraordinary year for solar PV additions in China, with over 50 GW of new capacity, exceeding the combined capacity additions of coal, gas and nuclear, and up from 35 GW in 2016. The new solar PV capacity added in China in 2017 alone is equivalent to the total solar PV capacity of France and Germany combined.
In the United States, 10 GW of solar PV was added in 2017, down 30% relative to 2016 but still the second highest year on record. In India, a record 8 GW of solar PV capacity was added in 2017, double the additions seen in 2016. In the European Union wind saw a record year with 15.6 GW of capacity additions, of which 3.1 GW was offshore, also a record. With continued growth in onshore wind power, global wind capacity (onshore and offshore) reached about 510 GW.
Outside of the power sector, only a modest increase of biofuels output of 2% (50 kb/d) was observed in 2017, slightly lower than growth the previous year, reflecting a longer-term downward trend in new production capacity investment. Increased ethanol output in the United States and Europe was partially offset by lower production in Brazil, while biodiesel output remained broadly stable. Renewable heat has been growing modestly over the last years.
China, the world’s largest heat consumer, announced a five-year clean heating plan focused on northern cities in December 2017. This policy change could significantly cut the use of coal for heating and replace it with cleaner sources including renewables (biomass, geothermal and solar heat).
Although renewables grew rapidly in 2017, the pace of deployment falls short of that needed to meet the global climate goals in the IEA’s Sustainable Development Scenario. Carbon emissions intensity in 2017 improved by less than one-third of what would be needed to fulfill the global transition towards climate goals.
Source: IEA
Full IEA Report: Global Energy & CO2 Status Report 2017