Renewable energy costs for the four main clean energy technologies is covered in an exhaustive new report from IRENA: Renewable Power Generation Costs in 2017.
The cost trajectories for Concentrated Solar Power (CSP), solar PV, onshore and offshore wind can be found in the full report which notes:
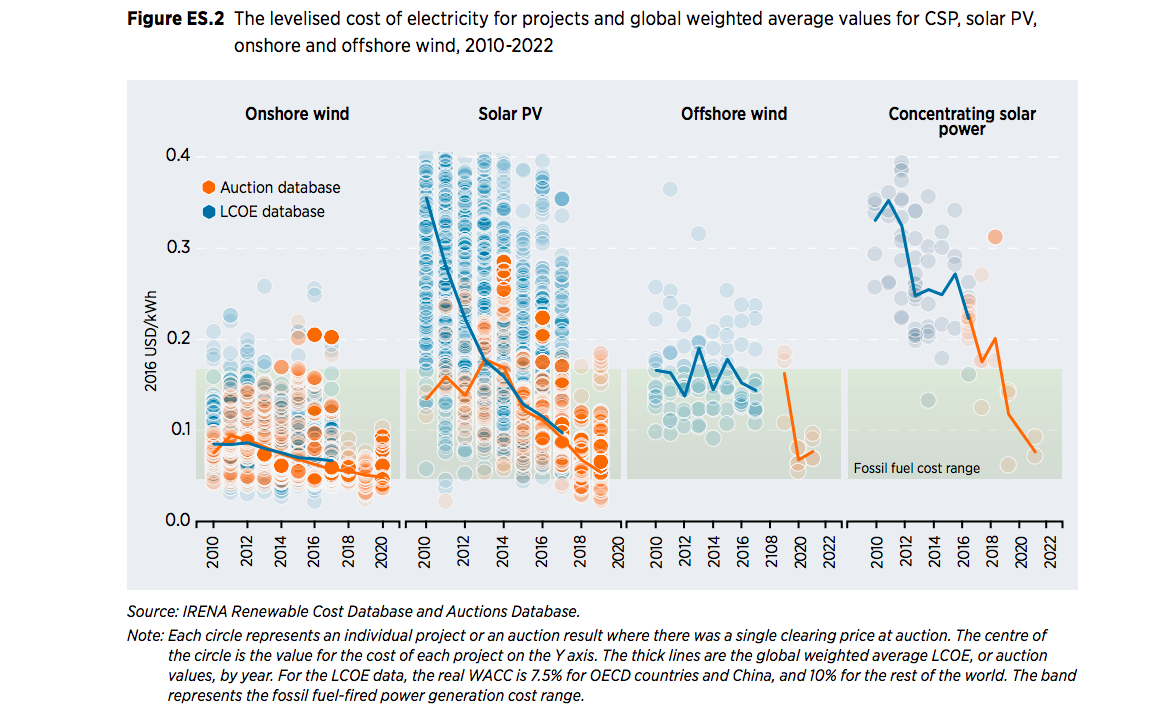
“The sharp cost reductions for CSP, solar PV, onshore and offshore wind – both recent and anticipated – represent remarkable deflation rates. Simultaneously, various new cost reduction drivers are emerging. Competitive procurement, notably auctions, has resulted in more transparent costs, while global competition has brought the experience of a myriad of project developers to new markets. Their combination of expertise, purchasing power and access to international financial markets is further driving down project costs and risks, and a string of record-low auction prices for solar PV, concentrating solar power (CSP), onshore wind and offshore wind power were set in 2016-2017.
CSP and offshore wind had cumulative installed capacity of just 5 GW and 13 GW respectively at the end of 2016, while the cost of electricity from recently commissioned projects for these technologies is higher than for other renewable power generation technologies. Yet costs are coming down. For CSP, 2016 and 2017 have been breakthrough years, as auction results around the world have confirmed that a step change in costs has been achieved.”
Comparing the CSP price trajectory with that of offshore wind in 2017, IRENA notes:
“The progression for CSP appears to be equally, if not more spectacular”
“For CSP, 2016 and 2017 have been breakthrough years, as auction results around the world have confirmed that a step change in costs has been achieved and will be delivered in projects commissioned in 2020 and beyond. Indeed, auction results in 2016 and 2017 suggest that projects commissioned from 2020 onwards could fall in the range USD 0.06 and USD 0.10/kWh.
Auction results in 2016 and 2017 suggest, however, that projects commissioned from 2020 onwards will fall in the range USD 0.06 to USD 0.09/kWh, excluding grid connection costs, and USD 0.07 to USD 0.10/kWh, including grid connection costs.
The successful bidder for the recent Dubai auction heralded a new price paradigm, while Australia has also announced a highly competitive project in South Australia.
With slightly longer lead times for commissioning, notably for the 700 MW Dubai Electricity and Water Authority (DEWA) project, by 2022, CSP will be providing electricity in the USD 0.07/kWh range, while the South Australian Port Augusta project is expected to be online in 2020 and delivering electricity at a price of USD 0.06/kWh
Auction results suggest that concentrating solar power (CSP) and offshore wind will provide electricity for between USD 0.06 and USD 0.10/kWh by 2020. Sharp cost reductions – both recent and anticipated – represent remarkable deflation rates for various solar and wind options. Learning rates2 for the 2010-2020 period, based on project and auction data, are estimated at 14% for offshore wind, 21% for onshore wind, 30% for CSP and 35% for solar PV.
Reductions in total installed costs are driving the fall in LCOE for solar and wind power technologies to varying extents. This has been most notable for solar PV, CSP and onshore wind. The total installed costs of newly commissioned CSP projects fell by 27% in 2010-2017, with a 33% LCOE reduction overall.
High learning rate for CSP
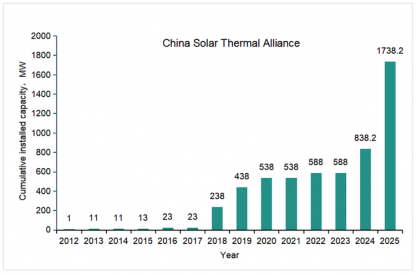
CSP has a relatively high estimated learning rate of 30%, with deployment between 2010 and 2020 representing an estimated 89% of cumulative installed capacity by the end of that period.
Learning rates (the cost decrease with every doubling of cumulative capacity) for CSP have been previously estimated to be between 10% and 12% (Neij, 2008); (Haysom et al., 2015); (Fraunhofer ISE, 2013).
However, recent analytical work suggests higher learning rates for CSP since 2013, with an estimated learning rate above 20% (Lilliestam et al., 2017; Pitz-Paal, 2017). If the auction results for Dubai and South Australia are factored in, then for the period 2010-2022 the learning rate could reach 30%.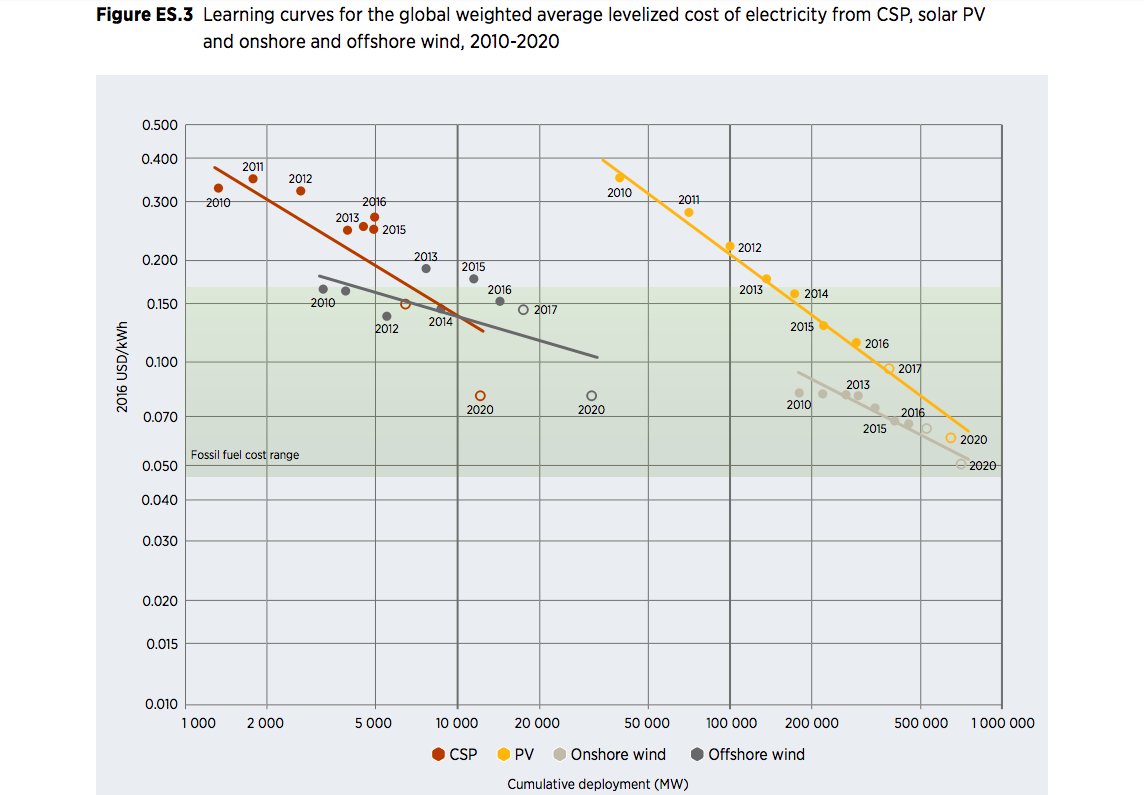
CSP costs dropped despite its “infancy”
Offshore wind power and concentrated solar power (CSP), though still in their infancy in terms of deployment, both saw their costs fall between 2010 and 2017. The global weighted average LCOE of offshore wind projects commissioned in 2017 was USD 0.14/kWh, while for CSP, it was USD 0.22/kWh. However, auction results in 2016 and 2017, for CSP and offshore wind projects that will be commissioned in 2020 and beyond, signal a step-change, with costs falling to between USD 0.06 and USD 0.10/kWh for CSP and offshore wind.
Even by 2020, projects contracted via competitive procurement will represent a relatively small subset of annual new renewable power generation capacity additions – and trends in auction results may not remain representative of LCOE trends at a project level. Nevertheless, recent auction results show that cost reductions will continue for CSP, solar PV, onshore and offshore wind through 2020 and beyond. While the validity of comparing LCOE and auction prices for individual projects must be done with caution, the volume of data available and the consistent trends between the two datasets provide some confidence in the overall trend.
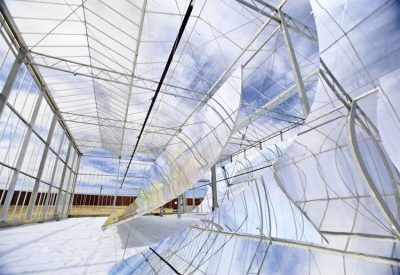
Technological improvements in solar field elements, such as collectors and mirrors, reduced costs in installation and engineering, and cost reductions in specific components are expected for CSP. The technology is also expected to experience declines in its indirect costs and the owner’s cost elements, with slightly higher cost reduction potential in these items for solar towers, compared to PTC. This can be explained with reference to the lower deployment of solar towers so far.
Even though CSP deployment has been somewhat limited compared to other renewable power generation technologies, there exist significant opportunities for cost reductions as deployment grows. These cost reduction potentials will enable CSP’s market presence to grow and for this technology to contribute substantially to the global energy transition towards a low carbon future.
With larger deployment, the risk margins of suppliers and EPC contractors would also fall, as developers and other players gain more experience (IRENA, 2016a).
Value of storage
CSP has the advantage that it can be equipped with low-cost thermal energy storage. This allows CSP to provide dispatchable renewable power. CSP therefore can offer advantages, such as allowing for generation to be shifted to times when the sun is not shining or to maximising generation at peak demand times. CSP with integrated storage can thus be a cost effective, flexible option in different locations, especially in the context of increasing shares of VRE. (Lunz et al., 2016; Mehos et al., 2015).
although the LCOE is a useful metric for a first-order comparison of the competitiveness of projects, it is a static indicator that does not take into account interactions between generators in the market. The LCOE does not take into account either that the profile of generation of a technology may mean that its value is higher or lower than the average market price it might receive. As an example, CSP with thermal energy storage has the flexibility to target output in high cost periods of the electricity market, irrespective of whether the sun is shining.
Cost of storage
Total installed costs for CSP plants that include thermal energy storage tend to be higher than those without, but storage also allows for higher capacity factors. For example, for parabolic trough systems (the technology with the highest share of installed projects so far), total installed plant costs can range between USD 2 550 and USD 11 265/kW for systems with no storage. Adding four to eight hours of storage, however, can see this range increase to between USD 6 050 and USD 13 150/kW for projects for which cost data is available in IRENAs Renewable Cost Database for the period 1984-2016. (Figure 4.3).
A time series of such projects from 2009-2016 shows that PTC and ST CSP capital costs for systems with no storage displayed a wide range during the period, varying between USD 2 550 and USD 11 300/kW. The majority of these projects started operating between 2009 and 2013 in Spain and still benefitted from, or where conceived under, the generous Spanish FiT incentive of that time that kickstarted this second phase of CSP development. After a downward trend from the very early plants built in California in the 1980s, capital costs for PTC without storage started to increase as projects shifted to Spain. Projects from this era in the IRENA Renewable Cost Database, range in costs between USD 3 650 and 11 300/kW (Figure 4.4) for the period of 2009-2013.
There was also a strong capital cost increase for PTC without storage during the period 2008-2011. This increase could in part be explained by the comparatively lower solar resources in the project locations in Spain, but analysis allowing for Direct Normal Irradiance (DNI) suggests that at least 65% of the cost increase ought not to be attributed to the lower solar resources, but to fundamental cost increases in the configuration (Lilliestam et al., 2017). Figure 4.4 shows the narrower range of between USD 2 550 and USD 7 000/kW that can be observed for the ‘no storage’ configuration in the IRENA Renewable Cost Database for more recent PTC and ST plants, installed since 2014. Parabolic trough and solar tower projects with up to four hours of storage show a range of total installed costs between USD 3 500 and USD 9 000/kW (though projects of this kind with
LCOE history
The LCOE of CSP plants stayed relatively stable between 2009 and 2012. Significant deployment during 2012, primarily in Spain (at least 800 MW), along with a couple of projects in the United States and in a few other countries, coincided, however, with a widening of the LCOE range in that year as more competitive plants were also commissioned (Figure 4.9). A downward trend in LCOE started in 2012. Indeed, during 2013 and 2014, the LCOE estimates were, on average, about one fifth lower than those of the 2009-2012 period. This decrease, coincided with a geographical shift away from Spain to newer markets with higher solar resources and sometimes, lower installed costs. Higher levels of Direct Normal Irradiance (DNI), were , however, likely the main factor behind lower levelised costs during that period (Lilliestam et al., 2017). Learning effects and technology improvements have not yet, therefore been the main driver of cost reductions, leaving significant cost reduction potentials to be unlocked as already highlighted (IRENA, 2016a).
During 2016 the capacity weighted average LCOE of CSP plants was estimated to be USD 0.27/kWh (a fifth lower than in 2009) although IRENA data suggests that the LCOE, although about 18% during 2017 to USD 0.22/kWh. The LCOE estimates discussed in this section assume a 25-year economic life and a WACC of 7.5% in OECD countries and China, and 10% elsewhere. Apart from increased DNIs at project locations between 2012 and 2014, the downward LCOE trend observed during 2012 and 2014 can be explained by a similar upward trend in the capacity factor of plants. The growth in the capacity factors of CSP during this period is not only related to higher solar resource availability, but also due to plant configurations with higher storage capacities and dispatching abilities.
From 2014-2016, thin deployment makes it difficult to come to definitive conclusions regarding the LCOE trend, but a range between USD 0.14 and USD 0.35/kWh can be observed for projects for which cost data is available in the IRENA Renewable Cost Database. The LCOE of most projects in this period is below USD 0.30/kWh (Figure 4.9). Recent announcements and analysis of planned projects seems to predict a clear downward trend, too, starting in 2017 (Lilliestam et al., 2017). Indeed, recently, very low bids for CSP projects have been announced. Examples include the USD 0.073/kWh bid announced by the Dubai Electricity and Water Authority (DEWA) for a 700 MW plant at the Mohammed bin Rashid Al Maktoum Solar Park (DEWA, 2017) and the Port Augusta CSP project in Australia, at around USD 0.06/kWh.
These results should be treated with caution, as a direct comparison with project level LCOEs is complicated given PPA prices and LCOE often do not represent a like-for-like comparison due to auction prices being dependent on a set of obligations and terms in the contract that can be very market and project specific. The other important point to take into consideration is that these prices apply to projects that will be commissioned in the period 2020-2022 and beyond. However, these announcements do point towards the increased competitiveness of renewable energy projects compared to fossil fuel alternatives and that by 2020 commissioned CSP plants will increasingly be delivering electricity at a cost that is within the lower end of the fossil fuel fired cost range (Figure 4.10).”